Max Temperature

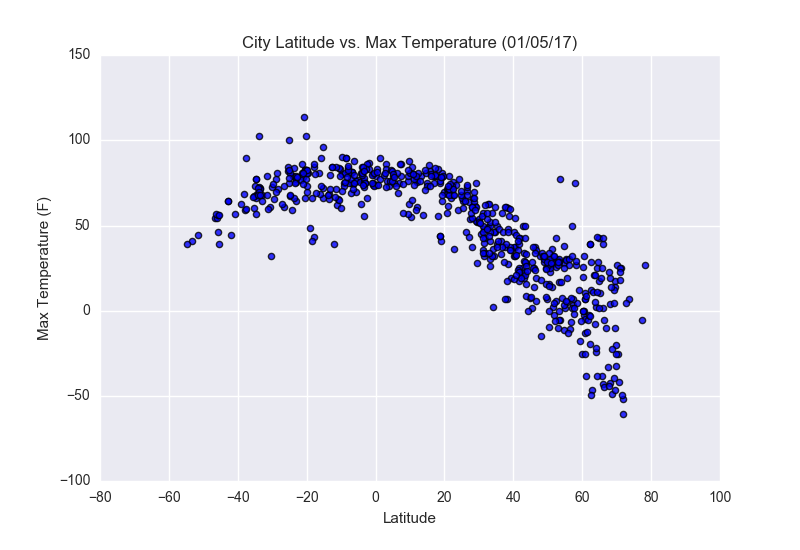
The plot for latitude and max temperatures shows that nearer to the poles (the far left and far right of the plot) temperatures are lower. Nearer to the equator (Latitude = 0) temperatures are higher. The curve seen in the plot with temperatures higher near the equator was expected, since it's known that the equator receives direct sunlight making it warmer there as compared to locations farther from the equator.


